
Reports
Reports are the whole point of Client Reporter - they take the data collected from your integrations and turn it into a tidy document you can hand to a client.
A report is made of blocks, and each block is fed by the integrations attached to a Site: analytics summaries, ecommerce figures, uptime, CMS activity and so on. You can generate reports as PDFs (dompdf by default, or Browsershot on a VPS if you want) and share them with clients. Every report can be fully white-labelled as your agency - see Branding.
Anatomy of a report
A report belongs to a Site (and, through it, to a Client). Here's what makes one up:
- A title - shown on the cover, and also used as the email subject and PDF filename.
- A date range - the reporting period. Pick a preset (last week, last 30 days, this month, last month, this quarter, last quarter) or set your own custom start/end date.
- An optional previous-period comparison. Turn it on and every block that supports comparison also grabs the period right before it, of equal length, so deltas ("+12% visitors") show up on their own.
- An intro / commentary. The report has an introduction, and each block can carry its own per-section commentary in your own words.
- Ordered blocks. The body of the report is a list of blocks in a fixed order. Each block has a heading, optional commentary, its own configuration, and can be hidden without deleting it.
Behind the scenes a report moves from draft to final the first time it is generated, and records a generated_at timestamp.
Available block types
Blocks come from two places, merged together by the block registry:
- Core blocks, always there no matter which integrations you've connected (registered in
config/client-reporter.phpunderreport_blocks). - Integration-provided blocks, contributed by installed integrations via
Integration::reportBlocks()- the WordPress and Craft CMS blocks, for example.
Each block says which integration (or integration category) it needs. In the builder, the "add section" menu only shows you blocks whose data source is actually live for that Site (see Building a report).
Blocks are grouped in the builder menu by category:
| Group | Block | Type key | Needs |
|---|---|---|---|
| Structure | Cover | cover | - |
| Closing message | closing | - | |
| General | Contents | contents | - |
| Content | Text & commentary | text | - |
| Website | Website overview | website-overview | - |
| CMS status (WordPress) | cms.status | WordPress connector | |
| Updates (WordPress) | cms.updates | WordPress connector | |
| Craft status | craft.status | Craft connector | |
| Craft updates | craft.updates | Craft connector | |
| Analytics | Analytics summary | analytics.summary | an analytics provider |
| Visitors chart | analytics.chart | an analytics provider | |
| Top pages | analytics.top_pages | an analytics provider | |
| Traffic sources | analytics.sources | an analytics provider | |
| Top countries | analytics.countries | an analytics provider | |
| Top devices | analytics.devices | an analytics provider | |
| Custom events | analytics.events | an analytics provider | |
| Ad performance | ads.summary | Google Ads | |
| Search | Search performance | search.summary | a search provider (Search Console) |
| Ecommerce | Store performance | ecommerce.summary | a store (WooCommerce, Craft Commerce, Shopify) or Stripe |
| Forms & Leads | Leads & signups | forms.summary | a forms/marketing provider |
| Uptime | Uptime summary | uptime.summary | an uptime monitor |
| Incidents | uptime.incidents | an uptime monitor | |
| Performance | Core Web Vitals | performance.summary | a performance provider (PageSpeed) |
| Billing | Billing & invoices | billing.summary | an accounting provider (FreeAgent, Xero) |
"An analytics provider" means any connected integration in that category - for analytics that's GA4, Plausible, Fathom, Matomo or Umami. The store block is deliberately source-agnostic: it reads whichever ecommerce or payments source the Site has connected.
Most data blocks give you options in the builder (the analytics summary, for instance, lets you choose which metrics to show and whether to compare to the previous period). Structural blocks like the cover, contents and closing message take their content from the Site, the period and your branding.
Building a report
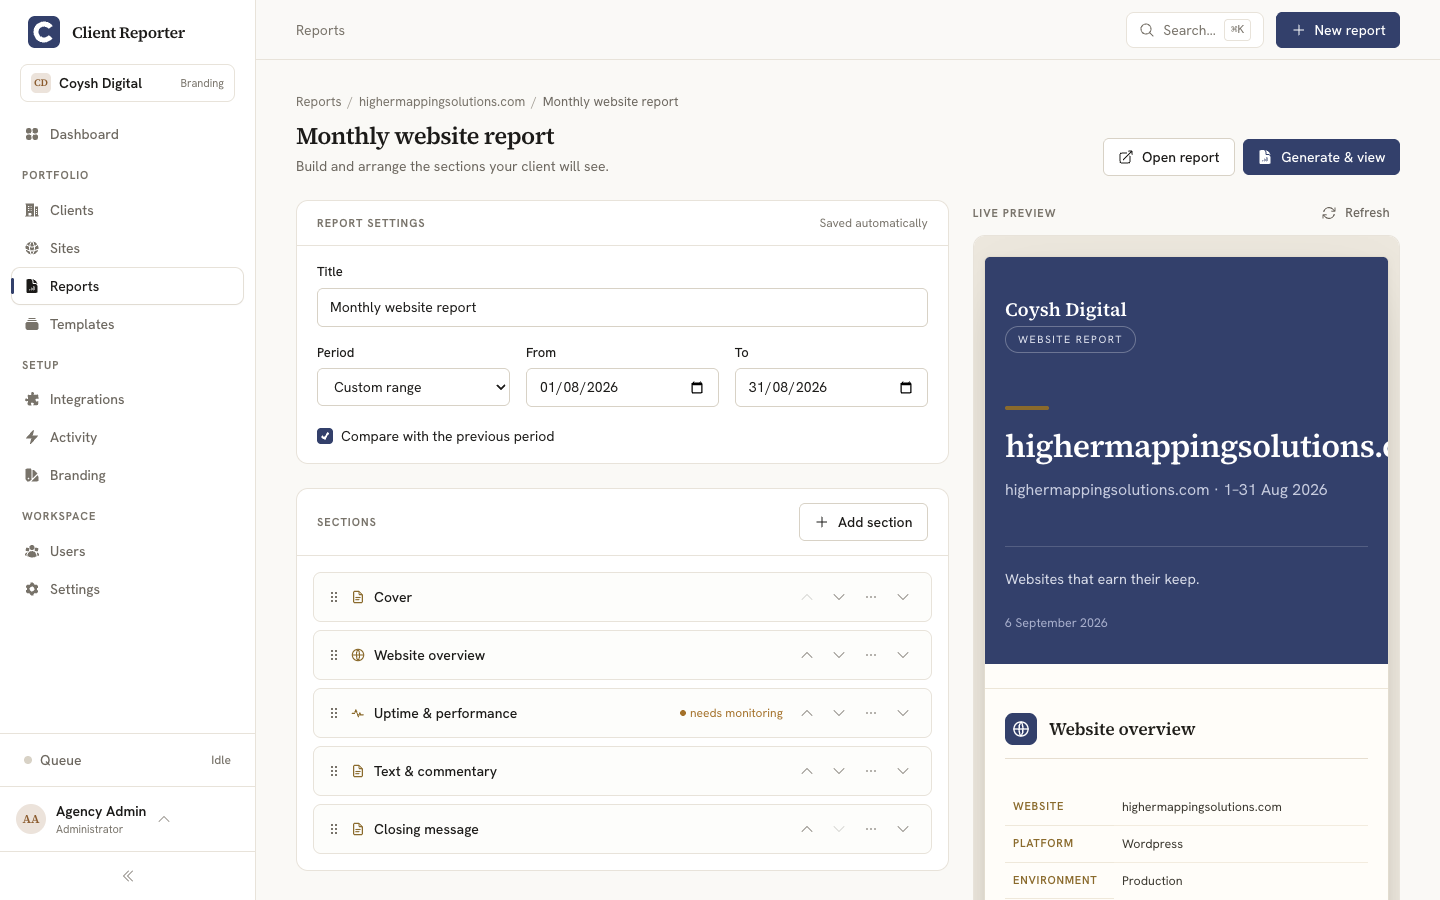
- Create the report for a Site (
/reports/create). Choose the Site, a title, the date range (preset or custom) and whether to compare to the previous period. If you like, start from a template. - Seeding. A blank report starts with a sensible default spine - cover, introduction, website overview and a closing message - or with the template's blocks. Only blocks the Site can actually feed get seeded; the rest are quietly skipped.
- The builder (
/reports/{report}/edit) is a drag-and-drop editor. Here you can:- Add sections from the grouped "add block" menu. Only blocks whose data source is live for the Site show up - you won't see Craft blocks on a WordPress-only site, and the store block only appears when the Site has an ecommerce source. Blocks that need an integration you don't have get flagged with a requirement warning.
- Reorder blocks by dragging them around.
- Edit each block's heading and write per-section commentary in your own voice.
- Tweak per-block options, hide a block without deleting it, or remove it.
- Change the report settings (title, range, comparison, intro) whenever you want.
- Live preview. The builder shows a live preview that resolves real block data for the current period (and comparison), so you're looking at the actual report as you edit it.
Availability comes down to which integrations are connected or need attention for the Site - a broken connection still counts as "present", so the block stays visible.
Report templates
A report template is a reusable, named set of ordered block definitions (with headings and per-block config) that you can apply to any Site. You manage them in the Templates area (/templates).
When you create a report and pick a template, its blocks seed the report instead of the default spine - and again, only the blocks the chosen Site can actually feed are kept. Templates let you nail down a "monthly SEO report" or "ecommerce report" layout once and reuse it across all your clients.
Generation and the frozen render
Generating a report is what turns a live, editable draft into a stable deliverable. When you hit generate (from the builder or the report's page), the generator:
- Collects the exact period. For every visible block, it works out which integrations that block needs, then collects the report's date range - and the comparison period, if you've enabled it - for each of those integrations on the Site. That way the exact-period data exists before anything gets resolved.
- Resolves branding for the Site by cascading global → client → site branding.
- Freezes a
ReportRendersnapshot - the fully resolved data for every visible block, plus the branding snapshot and the period/comparison metadata - stored as one immutable record. - Marks the report
finaland stampsgenerated_at.
Everything a client can see - the shared link, the emailed copy, the PDF - comes from the frozen render, never from live data. So a shared report loads instantly and stays exactly as it was when you generated it, even if you later reconnect integrations, re-brand, or the underlying metrics shift. Want a fresh render? Just regenerate the report.
Scheduling reports
Not every site needs a report on a clock, so scheduling is opt-in per site. On a site's edit page there's a Reporting schedule section where you can set a frequency - Weekly, Monthly or Quarterly - and, optionally, a template to build the report from (leave it on "Default sections" if you'd rather use the standard spine). Leave the frequency on "Not scheduled" for sites you report on by hand.
Once a period has fully closed, the client-reporter:generate-scheduled command (run daily by the scheduler) picks up each scheduled site, creates the report for that period, and generates it - pulling the data and freezing the snapshot, exactly as if you'd made it yourself. It won't touch the current, still-open period, and it never duplicates a report you've already made for a period.
Crucially, sending stays manual. A scheduled report lands as generated-but-unsent, and shows up on your dashboard under "Needs attention" as ready to send - so you always review it and decide when (and whether) a client sees it. Nothing goes out on its own.
If a scheduled generation fails (say an integration is down), nothing half-made is left behind - the next daily run simply tries again.
Outputs
Once a report is generated you can hand it over in a few different ways, all coming from the same frozen render and all fully white-labelled:
- Web preview (admin). Your team can preview the report inside the admin (
/reports/{report}/preview) and view the generated report on its page (/reports/{report}). - PDF export.
/reports/{report}/pdfstreams a branded PDF. The driver is dompdf by default (no binaries, works on any shared host); on a VPS you can switch to Browsershot (headless Chromium) for pixel-perfect output. See Configuration. - Branded email delivery. From the share panel you can email the report straight to the client. The email goes out entirely as your agency (sender name, reply-to and everything else visible come from the resolved branding), carries a secure link, and can attach the PDF.
- Public share links. Secure, no-login links at
/r/{token}:- The token is random and stored only as a SHA-256 hash - the plaintext is shown once at creation and never saved, so reading the database can't hand anyone a working link.
- Links support an optional expiry (in days), an optional password, and revocation at any time.
- The public route is rate limited (60 requests/minute, and password unlock attempts to 10/minute).
- A revoked, expired or ungenerated report shows an "unavailable" page instead of any data. View counts and last-viewed time are tracked.
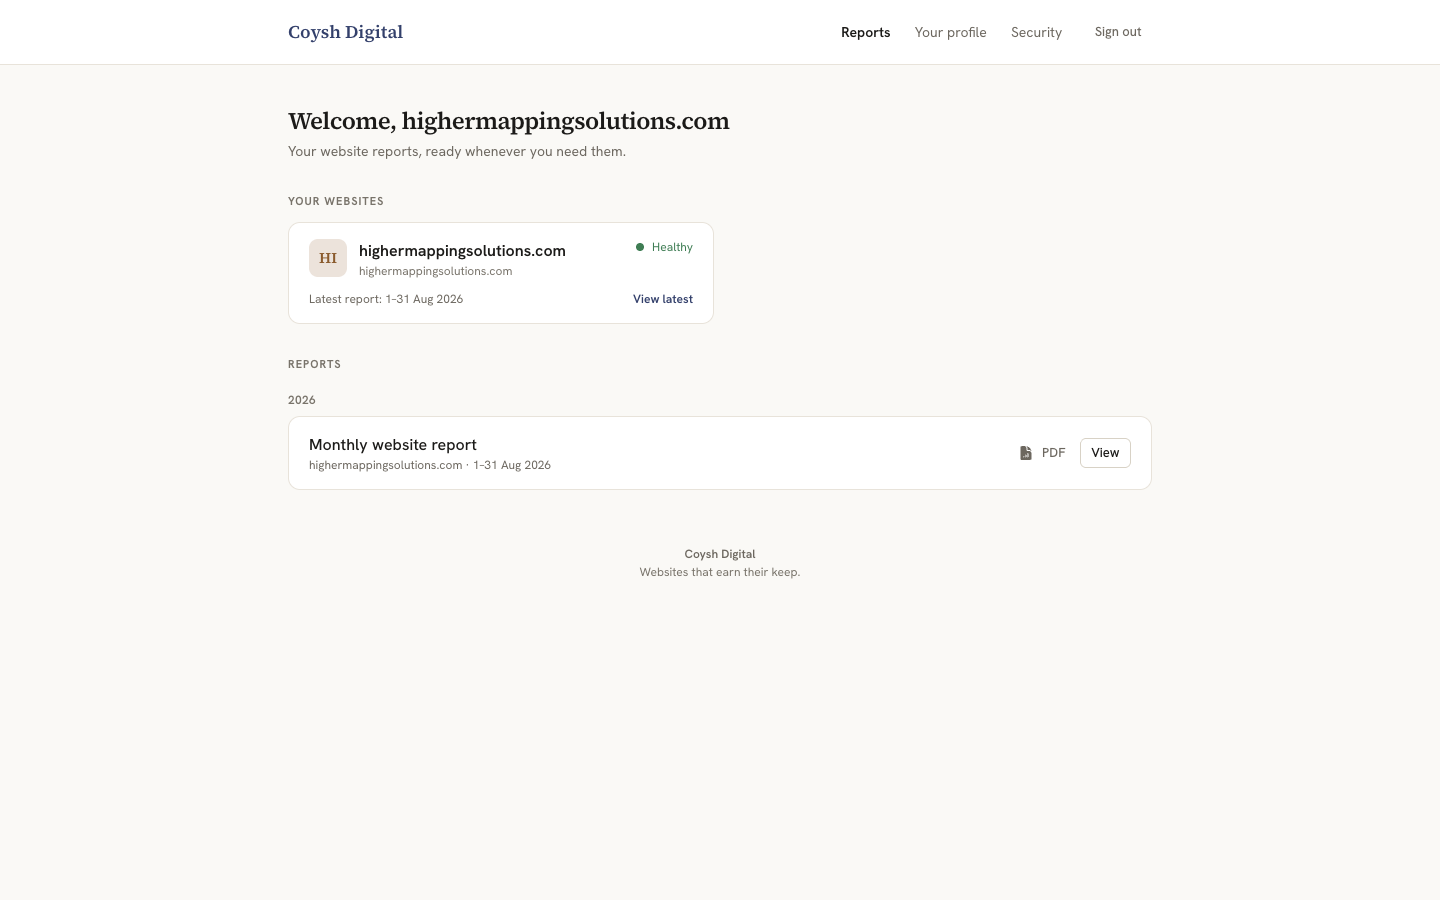
- Client portal. Clients with the restricted Client role sign in to the portal at
/portaland see only their own Client's sites and generated reports - one client can never open another's. The portal is agency-branded too (see below).
Related
- Branding - full white-labelling of every client-facing output, and how branding is frozen into a render.
- Configuration - PDF driver (dompdf / Browsershot), share-link defaults and data collection.
- Integrations - the data sources that feed report blocks.